Santa Barbara Channelkeeper measures the following water quality indicators through our Stream Team water quality monitoring program.
Dissolved Oxygen
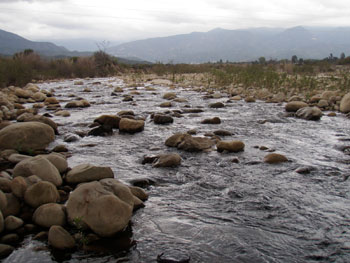
Aquatic organisms rely on the presence of oxygen in streams; not enough oxygen and they will move, weaken or die. In water, oxygen is a dissolved gas. Water temperature, altitude, time of day, and season can all affect the amount of oxygen in the water; water holds less oxygen at warmer temperatures and high altitudes. DO is measured either in milligrams per liter (mg/L) or “percent saturation.” Milligrams per liter is the amount of oxygen in a liter of water. Percent saturation is the amount of oxygen in a liter of water relative to the total amount of oxygen that the water can hold at that temperature.
As dissolved oxygen levels in water drop below 5 mg/L, aquatic life is put under stress. Colder water fish (trout) need levels above 6, and DO above 7 mg/L may be required for spawning. Warm water fish can probably tolerate levels as low as 4. The lower the concentration, the greater the stress. Oxygen levels that remain below 1-2 mg/l for a few hours can result in large fish kills. Oxygen is both produced and consumed in a stream. Because of constant churning, running water dissolves more oxygen in a stream than the still water found in pools. Aquatic plants and algae affect dissolved oxygen concentrations by releasing oxygen underwater during photosynthesis – DO is at a maximum in the late afternoon of a sunny day. Throughout the night, the same plants and algae, joined by the other aquatic organisms, remove oxygen through respiration, reducing levels of DO to their lowest by early morning. Early mornings, during periods of hot weather and low flows, are the best time to determine whether DO is declining to dangerous levels.
ph
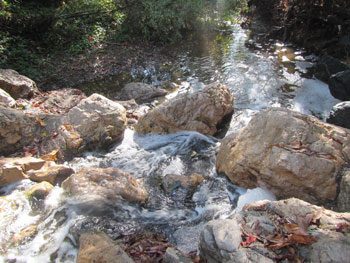
pH is a relative measure of alkalinity and acidity, it’s an expression of the number of free hydrogen atoms present. It’s measured on a scale of 1 to 14, with 7 indicating neutral – neither acid nor base. Lower numbers show increasing acidity, whereas higher numbers indicate more alkaline waters. Blood (pH of 7.5), seawater (9.3) and household ammonia (11.4) are all alkaline or basic; urine (6), oranges (4.5), Coca Cola Classic (2.5) and the contents of your stomach (2) are acidic. pH numbers represent a logarithmic scale so small differences in numbers can be significant: a pH of 4 is a hundred times more acidic than a pH of 6. Most species of life have a specific pH range in which they can survive. A wide variety of aquatic animals prefer a range of 6.5-8.0 pH. If pH is altered beyond an organism’s normal range it will suffer and soon die off. Many pollutants push pH readings toward the extremes of the scale. A change of more than two points on the scale can kill many species of fish. Low pH can also allow toxic elements and compounds to become mobile and “available” for uptake by aquatic plants and animals.
Conductivity
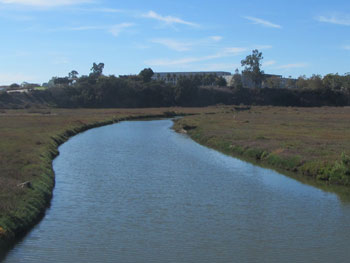
Water is one of the most efficient solvents in the natural world and has the ability to dissolve a great many solids. Many of these solids carry an electrical charge when put into solution. For example, chloride, nitrate, and sulfate carry negative charges, while sodium, magnesium, and calcium have a positive charge. These dissolved substances increase water’s conductivity – its ability to conduct electricity. Therefore, measuring the conductivity of water indirectly indicates the amount total dissolved solids (TDS). It’s not a perfect measure because some substances, particularly organic compounds like oil, alcohol or sugar do not conduct electricity well and have low conductivity, but conductivity is a rough approximation of TDS.
Each stream tends to have a relatively constant range of conductivity that, once established, can be used as a baseline for comparison with regular conductivity measurements. Significant changes in conductivity could then be an indicator that a discharge or some other source of pollution has entered a stream. Conductivity tends to decrease in the winter when heavy rainfall and runoff increase the amount of fresh water flow. With more water, mineral concentrations are more dilute. On the other hand, in late summer and fall, especially during periods of drought, the dissolved solids are more concentrated, raising conductivity. Conductivity is also affected by temperature: the warmer the water, the higher the conductivity. For this reason, conductivity is reported as conductivity at 25 degrees Celsius (25 °C).
The basic unit of measurement is the siemen. Conductivity is measured in micro-siemens per centimeter (µs/cm) or milli-siemens per centimeter (ms/cm). Distilled water has a conductivity in the range of 0.5 to 3 µs/cm. The conductivity of rivers in the United
States generally ranges from 50 to 1500 µs/cm. Drinking water usually has to meet a standard of 500 mg/L TDS – a conductivity of roughly 1000 µs/cm. Conductivity in Santa Barbara and Ventura streams is usually above 1000 µs/cm because of high mineral content in the easily eroded sediments that form our coastal mountains.
Turbidity
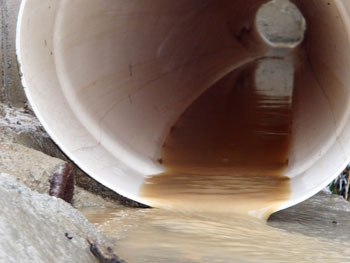
Turbidity is a measure of water clarity. Turbidity is affected by suspended particles, or solids that cannot dissolve, including clay, silt, sand, algae, and plankton. Natural factors like wave action, changes in seasonal light intensity, and erosion, can all alter turbidity. However, turbidity is often increased by human activities. Clear cut logging, construction, and mining all greatly increase unnatural soil erosion which rapidly changes turbidity. Regular monitoring of turbidity can help detect trends that might indicate increasing erosion from these activities. Changes in turbidity can have dramatic impacts on the aquatic ecosystem.
Examples include:
- Suspended sediments trap heat, raising the temperature of the water and decreasing the amount of oxygen it can hold.
- When turbidity levels are high, less light passes through the water, and photosynthesis slows, decreasing oxygen levels and primary productivity.
- Water that is highly turbid can clog the gills of fish and bury their eggs.
Temperature
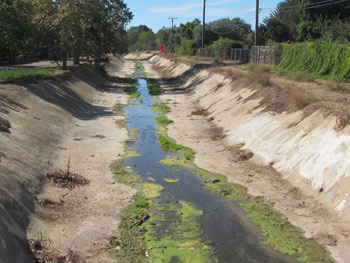
Water temperature directly affects biological and chemical processes. Some fish species, such as steelhead trout, prefer colder water, others prefer warmer water. For example, trout need temperatures lower than 19 °C (66 °F) to do well and lower than 9 °C (48 °F) to spawn, but can stand temperatures as high as 24 °C (75 °F) for short periods; for catfish, these limits are 32 °C (90 °F), 27 °C (81 °F) and 35 °C (95 °F). Water temperature affects the oxygen content of water – the higher the temperature, the less oxygen it can hold. Fish and benthic macro-invertebrates will move around within the stream to find their optimal temperature.
Temperature can also be affected by many human activities for examples by:
- Building dams or artificial stream channels alters the flow rate, which in turn can affect temperature.
- Removing streamside vegetation reduces shade which would normally keep the water cool.
- Construction or other human activities near streams can increase sedimentation, which traps more heat in the water.
- Water effluent from industrial sources such as power plants can drastically change water temperatures.
Flow
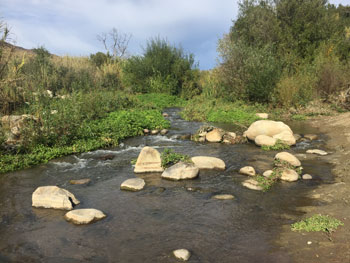
Stream flow is the volume of water that moves past a fixed point during a specific interval of time. Flow is generally measured in cubic feet per second (cfs) – the number of cubic feet of water moving down the stream channel in one second. Think of it as the width of the stream at some point, times its average depth times its average velocity: (width in feet) x (depth in feet) x (velocity in feet per second) = flow in cubic feet per second. Knowing the flow is critical in calculating the amount of a contaminant in a stream. When we test for bacteria, nutrients, or total dissolved solids, we only determine the concentration in the water. Once we measure flow we can we quantify the actual amount being carried through the system (the amount is equal to the flow multiplied by concentration).
Flow affects water quality in a variety of ways:
- Flow influences the ability of a stream to dilute pollution; large, swift rivers have a greater ability to dilute pollution than smaller streams.
- Flow and velocity affect the available oxygen level in water: higher velocities and flows generate higher levels of turbulence which in turn, cause more air to be mixed within the flow. Streams with higher flows generally have more oxygen available for aquatic organisms.
- Flow controls the amount of sediment that is transported in a stream. Streams with higher velocities and larger flows can transport greater amounts of sediment
Nutrients: Nitrate and Orthophosphate
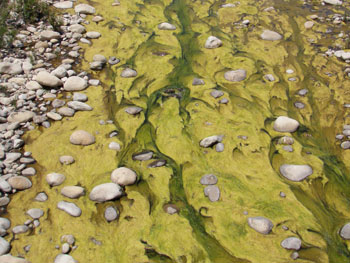
While both phosphorus and nitrogen are essential nutrients for plants and animals that make up the aquatic food web (nitrogen for protein synthesis and phosphorus for energy transformation in cells), in excess amounts they can cause severe problems.
Since phosphorus is the nutrient in short supply in most fresh waters, even a modest increase in phosphorus can, under the right conditions, set off a whole chain of undesirable events in a stream including accelerated plant growth, algae blooms, low dissolved oxygen, and the death of certain fish, invertebrates, and other aquatic animals. This over-fertilization is called eutrophication. There are many sources of phosphorus in water, both natural and human. These include soil and rocks, animal and plant waste, wastewater treatment plants, runoff from fertilized lawns and cropland, failing septic systems, runoff from animal manure, disturbed land areas and drained wetlands. Phosphorus in water comes in many forms. Both organic and inorganic phosphorus can either be dissolved in the water or suspended (attached to particles in the water column).
Nitrogen is also found in the water column in different forms: as dissolved inorganic nitrogen (nitrate, nitrite and ammonium) and as dissolved or suspended organic nitrogen (complex molecules associated with living, or once living, tissue). Nitrates are the most common form of nitrogen found in our local streams. Together with phosphorus, nitrates in excess amounts can accelerate eutrophication, causing dramatic increases in aquatic plant growth and changes in the types of plants and animals that live in the stream. This, in turn, affects dissolved oxygen, temperature, and other indicators. Excess nitrates can become toxic to warm-blooded animals, particularly babies, at higher concentrations (greater than 10 mg/L) and may also be cancer causing. Sources of nitrates include wastewater treatment plants, runoff from fertilized lawns and cropland, failing on-site septic systems, runoff from animal manure, and industrial discharges. Nitrates end up in rivers and streams more quickly than other contaminants like phosphorus, because they dissolve in water more readily and are not adsorbed on soil particles.
Channelkeeper samples are analyzed at UCSB for nitrate, dissolved organic nitrogen, phosphate and suspended organic nitrogen and phosphorus.
Fecal Indicator Bacteria
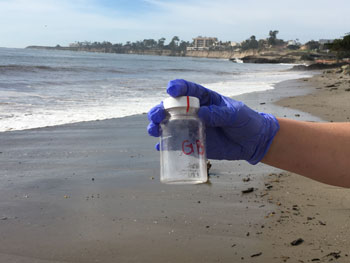
Members of two bacteria groups, coliforms and fecal streptococci, are used as indicators of possible sewage contamination because they are commonly found in human and animal feces. Although they are generally not harmful themselves, they indicate the possible presence of pathogenic (disease-causing) bacteria, viruses, and protozoans that also live in human and animal digestive systems. Therefore, their presence in streams suggests that pathogenic microorganisms might also be present and that swimming and eating shellfish might be a health risk. Since it is difficult, time-consuming, and expensive to test directly for the presence of a large variety of pathogens, water is usually tested for coliforms and fecal streptococci instead. Sources of fecal contamination to surface waters include wastewater treatment plants, on-site septic systems, domestic and wild animal manure, and storm runoff.
Stream Team collects samples that are brought back to the Channelkeeper lab and analyzed for three types of bacteria:
- Total Coliform: Total coliforms are a widespread group of bacteria in nature. All members of the total coliform group can occur in human feces, but some can also be present in animal manure, soil, vegetation and submerged wood and in other places outside the human body. Thus, the usefulness of total coliforms as an indicator of fecal contamination depends on the extent to which the bacteria found are fecal and human. For recreational waters, total coliforms are no longer recommended as an indicator, but they are still the standard test for drinking water because their presence indicates contamination of a water supply by an outside source.
- E. Coli: E. coli is a species of fecal coliform bacteria that is specific to fecal material from humans and other warm-blooded animals. EPA recommends E. coli as the best indicator of health risk from water contact in recreational waters.
- Enterococcus: Enterococci are a subgroup of the fecal streptococci bacteria, and are typically more human-specific. Enterococci are distinguished by their ability to survive in salt water, and in this respect they more closely mimic many pathogens than the other indicators. The EPA recommends enterococci as the best indicator of health risk in salt water used for recreation and as a useful indicator in fresh water as well.
Bacteria are reported as the “most probable number” (MPN) of bacteria in 100 milliliters (100 ml, about 4 ounces) of water; we use a statistical test instead of directly counting bacteria so the actual number is an estimate. California Public Health requirements for bacteria counts are complicated and vary somewhat by jurisdiction; what follows is simply a broad outline. There are two limits for each test, a single sample limit and a limit for an average of 5 or more weekly samples. For recreational use, the total coliform limits are “no more than 10,000 per 100 ml in a single sample, and an average of less than 1000.” For E. coli the “average” limit is 126 bacteria/100 ml of water and the single sample limit varies from 235 to 500 depending on intensity of use (235 for beach areas, 500 for occasional use). For enterococcus the “average of 5 or more samples” limit is 35 and the single sample limit is 104 (there is general agreement on the 35 limit, but various jurisdictions in the state vary the single sample limit between 104 and 500).
